Rent falls remain rare: September's postcode picture
2 November 2026 · SuburbCheck
Lower two-bedroom flat medians were recorded in nine of 163 eligible NSW and Queensland postcodes. Most recorded increases, and a fall did not always mean a low rent.
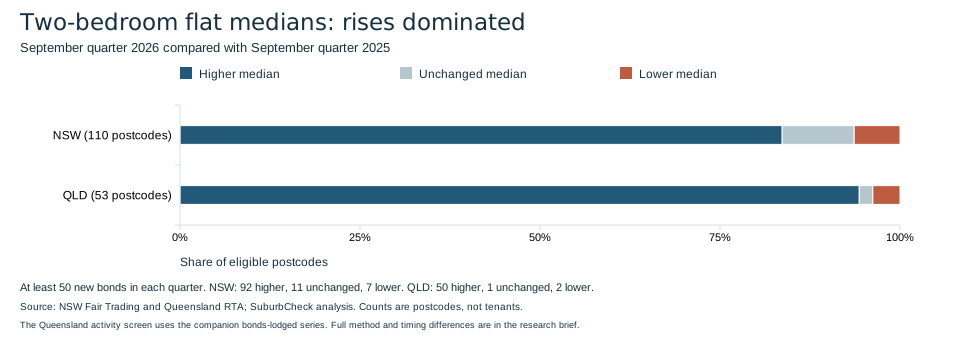
Two-bedroom flat and unit medians fell in seven of 110 eligible NSW postcodes and two of 53 Queensland postcodes in the September quarter of 2026, compared with the same quarter a year earlier.
The comparison covers July to September in both years and includes only postcodes with at least 50 reported new bonds in each quarter for that dwelling category. In Queensland, the bond count is an activity screen: its timing differs from the published rent series.
Across the screened postcodes, increases were much more common. Medians rose in 92 NSW postcodes and 50 Queensland postcodes. Eleven NSW postcodes and one Queensland postcode were unchanged. These counts describe local medians for new tenancies, rather than the number of tenants whose rent went up or down.
Where the medians fell
The nine falls show why both the direction of a change and the dollar level matter. A postcode can record a sizeable decline and remain an expensive place to rent.
NSW postcode 2008, which includes Chippendale and Darlington, had the largest percentage fall in this screened sample. Its median fell $75 a week, from $1,175 to $1,100, or 6.4%. Postcode 2022, covering Bondi Junction and Queens Park, also ended at $1,100 after a $50 fall.
Each row below is a postcode observation. The place names provide location context and are not separate suburb rent estimates. Dollar amounts are weekly medians; bond counts run from 2025 to 2026.
| Postcode and example places | 2025 | 2026 | Change | Bonds 2025 / 2026 |
|---|---|---|---|---|
| NSW 2008: Chippendale, Darlington (Sydney) | $1,175 | $1,100 | -$75 (-6.4%) | 100 / 88 |
| NSW 2022: Bondi Junction, Queens Park | $1,150 | $1,100 | -$50 (-4.3%) | 117 / 127 |
| NSW 2049: Petersham, Lewisham | $765 | $750 | -$15 (-2.0%) | 54 / 74 |
| NSW 2218: Carlton, Allawah | $680 | $667.50 | -$12.50 (-1.8%) | 99 / 64 |
| NSW 2032: Kingsford, Daceyville | $875 | $860 | -$15 (-1.7%) | 179 / 169 |
| NSW 2114: West Ryde, Meadowbank, Denistone | $700 | $692.50 | -$7.50 (-1.1%) | 146 / 146 |
| NSW 2011: Potts Point, Elizabeth Bay, Woolloomooloo | $1,100 | $1,097.50 | -$2.50 (-0.2%) | 169 / 156 |
| QLD 4067: St Lucia | $670 | $650 | -$20 (-3.0%) | 83 / 85 |
| QLD 4064: Paddington, Milton | $780 | $760 | -$20 (-2.6%) | 121 / 88 |
The movement in postcode 2011 was much smaller: $2.50 a week, or 0.2%. That is best described as broadly stable, although it remains a fall in the exact count. It would be a stretch to treat such a small change as strong evidence that the area had become easier to rent in.
The two Queensland postcode falls were both $20 a week. Postcode 4067, St Lucia, moved from $670 to $650. Postcode 4064, which includes Paddington and Milton, moved from $780 to $760. These are the only Queensland falls passing this particular postcode, dwelling and activity screen, rather than the only falls anywhere in the state.
Stability and increases nearby
An unchanged median can also be useful context. NSW postcode 2017, which includes Waterloo and Zetland, stayed at $1,150 a week. It recorded 934 qualifying bonds in the 2025 quarter and 907 in 2026, making it a much more active example than a postcode just above the threshold.
Elsewhere, postcode 2065, including Wollstonecraft, St Leonards and Naremburn, rose from $900 to $1,020 a week, an increase of 13.3%.
Queensland's separate suburb tables provide another contrast. Broadbeach's two-bedroom flat median rose from $775 to $950, up $175 or 22.6%. St Lucia's suburb median fell from $670 to $650, down 3.0%. These suburb figures illustrate local variation. They are not extra observations to add to the 53-postcode headline.
The house results also suggest caution about calling the exceptions broad rental relief. In a separate comparison using the same 50-bond screen, three-bedroom house medians rose in all 55 eligible Queensland postcodes and 60 of 65 eligible NSW postcodes.
Does the activity threshold change the picture?
Using a different minimum bond count changes which postcodes qualify, but falls remain uncommon.
At a minimum of 20 reported bonds in each quarter, two-bedroom flat medians fell in 11 of 166 NSW postcodes and five of 91 Queensland postcodes. At a minimum of 100, the counts were four of 61 in NSW and none of 28 in Queensland. Neither Queensland falling postcode met the higher screen in both quarters.
The 50-bond threshold is an editorial rule for excluding less active comparisons. It is not a test of statistical significance, and passing it does not make a small change conclusive.
What renters can take from the figures
These figures provide a starting point for comparing locations and dwelling types. Read the current dollar level alongside the percentage change, then check homes that match the size, condition and location you need. A falling median does not establish that suitable homes are available at that price now.
The median is the middle of the observed rent distribution. It can shift when a different mix of homes changes tenants, including differences in furnishing, quality and location within a postcode. This comparison does not follow the same properties through time or measure rent changes for continuing tenants.
The evidence therefore supports a narrow conclusion: lower medians were unusual in this screened NSW and Queensland sample. It does not establish a national trend or explain what caused any individual postcode's movement.
How we calculated it
For NSW, we pooled qualifying individual bond records from July, August and September in each year, then calculated postcode medians. We used the lodgement dates, flat dwelling code, two bedrooms and positive numeric rents. We did not average monthly medians or remove repeated-looking records that could represent different tenancies.
For Queensland, we used the RTA's published postcode medians and its companion new-bond counts. The rent series uses tenancy commencement quarters, while the count series uses bond lodgement quarters. Counts therefore screen activity rather than establish the exact sample behind each Queensland median. The suburb examples use the separate suburb sheets.
Changes are nominal and compare the 2026 median with the 2025 median. State results remain separate. The eligible sample excludes less active postcodes and does not represent all tenancies or every postcode.
Sources are NSW Fair Trading rental bond data and Queensland RTA rental data, using the source files retrieved on 1 November 2026. Download all 163 postcode comparisons.
Queensland data: The State of Queensland (Residential Tenancies Authority), 2026, CC BY 4.0. Analysis and visualisation by SuburbCheck.